Data Help
Questions?
You've started your research and want to know what resources you should use. We've consolidated our data resources into one accessible location at the Data page. This page will give you more detail on each of the options available. To save a search you need to be a logged in user. Once you have created a login you are ready to save your search. Simply enter a search name you will remember and a description for the search before you save. The next time you log in you can access the saved search under the tab labeled Saved Searches.
Data Search
What is it?

This is an advanced data query tool designed to enable the user to build a data set. You can drill in to the specific data that meets your requirements and then analyze the data. When you finish the selections, a data set will appear below the search items.
Steps to complete the query:
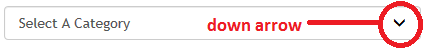
- Click the down arrow next to the "Select A Category" text. Below is an image of what the dropdown looks like in the data query.
- After making a selection, click on the screen to let the query know you are ready for the next selection option. You need to click outside of the dropdown menu to move to the next dropdown option.
- You will be prompted to select the next item in an additional dropdown menu.
- Once you have completed all of the selectable menu options, you will have a generate button appear to complete the query.
- At this point, you can view the data on your screen, download a csv file to analyze, or build a Tableau visualization or "viz". You will need to reselect your parameters and you will not be able to save your work with this visualization. Please select the Data Visualization tab at the top of the page in order to save the visualization.
- You can download an Excel file layout/data dictionary that helps explain the data results.
- You can Save your Data Search to revisit if you have created a login!
Would you like to try it on the Data page? Select a Category from the advanced Data Search dropdown to get started!
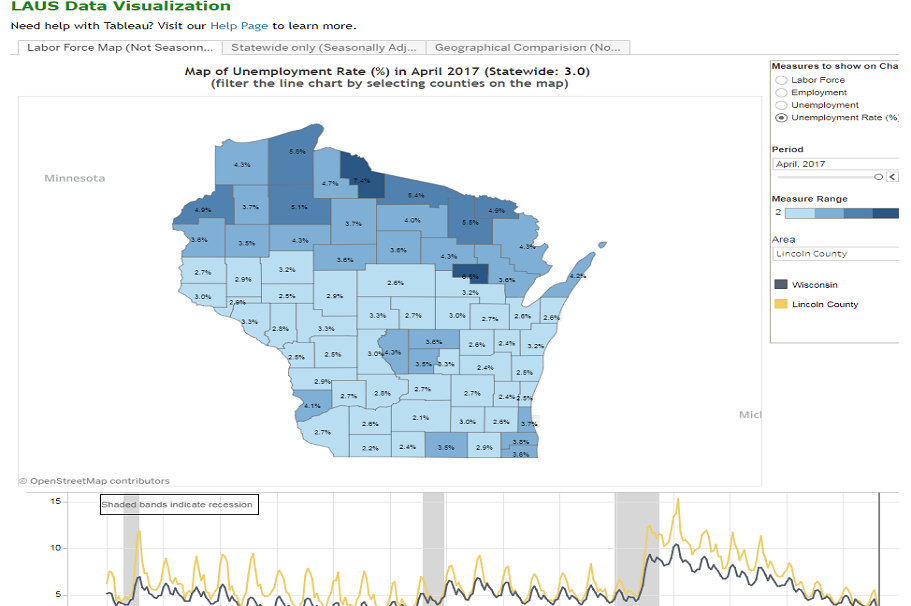
Data Visualization
What is it?

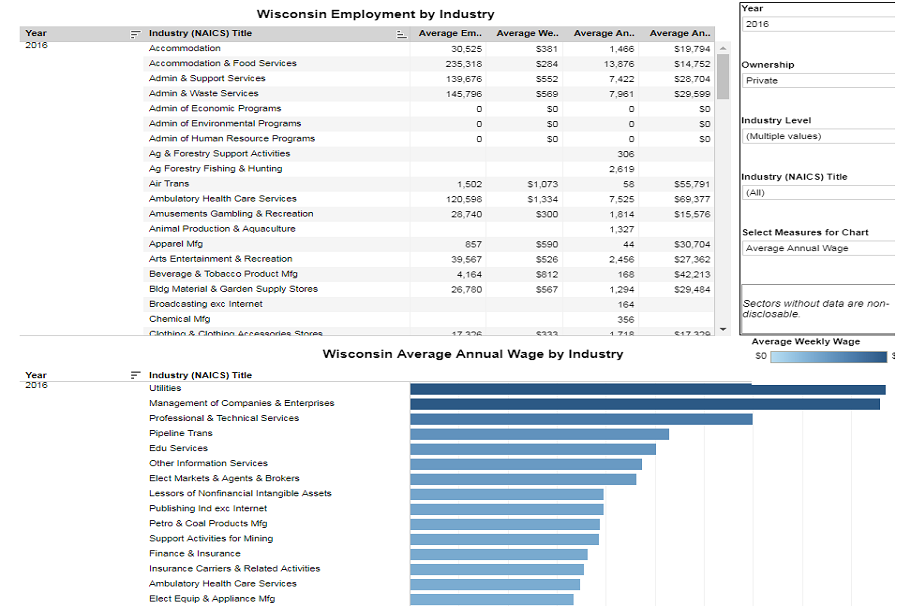
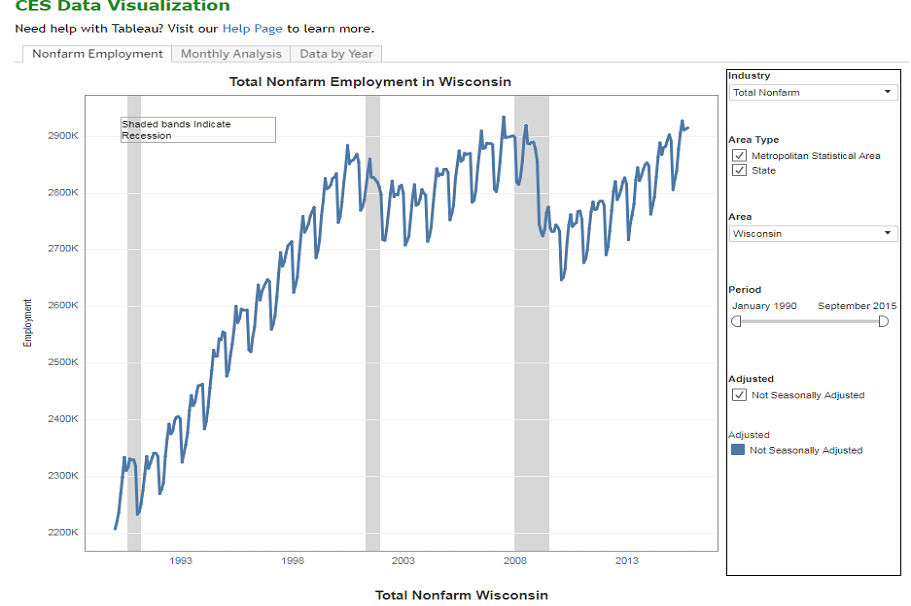
- This is an advanced data visualization tool designed to enable the user to build and save select measures in an interactive view. Note that all visualizations are best viewed from a desktop or laptop computer.
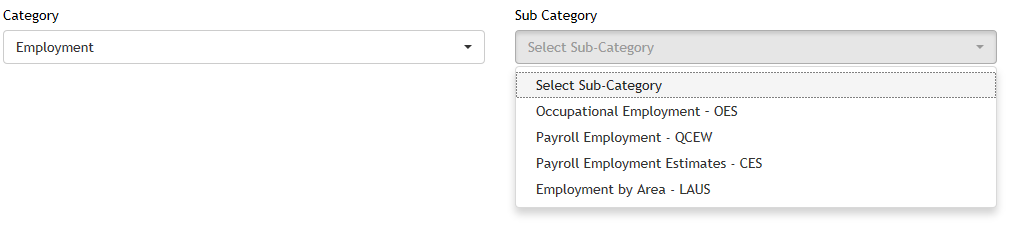
- You can drill in to the specific data that meets your requirements and create images to help understand the data. First select a Category and then Sub Category from the dropdown menus similar to the image below.
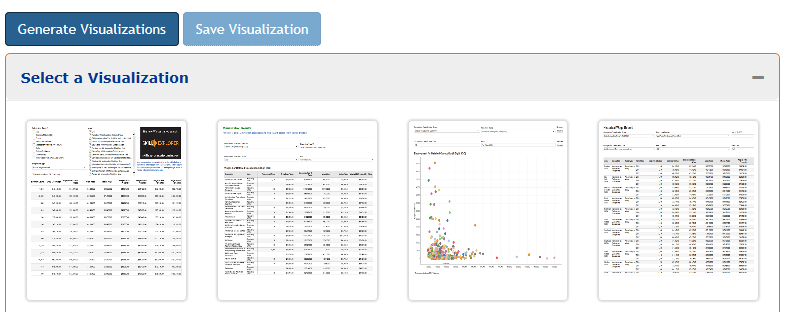
- When you finish selecting Category and Sub Category from the dropdown menus click the Generate Visualizations button, you will be able to select from thumbnail images to find a view that best fits your needs.
- If you have created a login AND you are logged into WisConomy the button will be blue as pictured below.
- If you have not created a login, you will not be able to save a visualization for later viewing. The Save Visualization button will be disabled as seen in the image below.
- After making changes to the visualization and you are logged into WisConomy, you will have the option to save the visualization. This will allow you to open the view later when logged into WisConomy.
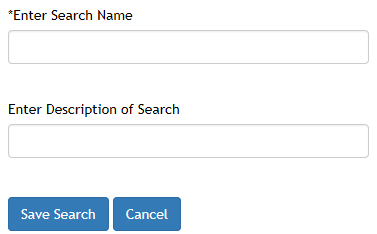
- You will be prompted to create a name and short description for the saved visualization by clicking the Save Visualization button.
- Simply fill out the form as pictured below and select the Save Search button. You also have the option to Cancel the save.
- You've saved a visualization. Now what? Keep reading to learn how to access your saved search or visualization below.

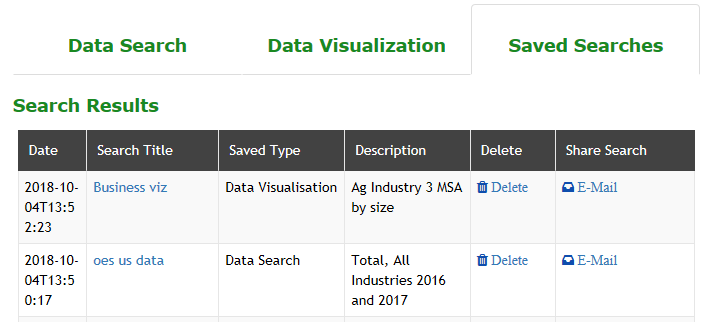
Saved Searches
Where are they?
- You have saved a search query or data visualization and now you want to view it again. Simply login and open the Saved Searches tab as shown in the picture below.
- As a logged in user with saved searches you will find a grid here as pictured below.
- Simply click on the saved search name under Search Title.
- Your visualization or saved search will open.
- You will see your selections in the dropdown menu to review before running the report.
- To run a saved data search simply select the Generate Report button.
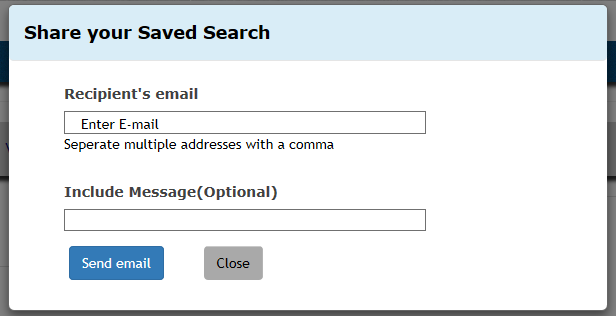
- You can share your Saved Searches with the E-Mail option on the right side of the grid.
- Enter an email and message to send the recipient. You can add multiple recipients by adding a comma with no spaces between the email addresses.
- Select Send email and off it goes! Or simply Close to cancel.

This should help get you started with the Data page on WisConomy. Each of the visualization tools has additional functionality to build reports, pdfs, and files to work with the data. Remember the best way to view the visualizations is on a desktop or laptop. Mobile views will not allow the full experience with some views. If you need additonal help or have questions contact us by email.
Program Downloads
What are they?
These are downloadable csv or Excel files that have been individually structured by each of our LMI Program Analysts. If you want to learn more about each program, visit them here.
If you need more direction, do not hesitate to reach out to the individual program leads at the Contact Us page.
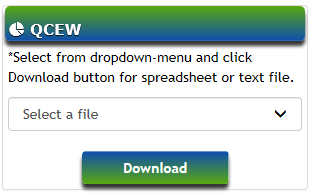
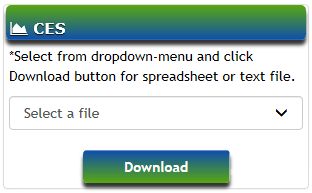
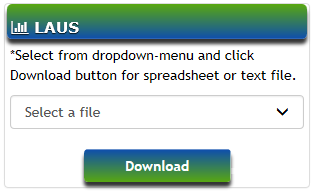
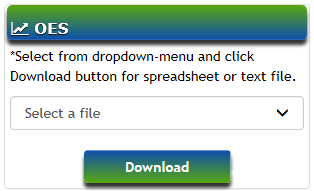
Steps to download files:
- Click the down arrow next to the "Select A File" text.
- Click the file you would like to download.
- Once you have selected a file to download left click the download button.
Identify which program data you would like to use: QCEW, CES, LAUS, or OES. You can click on the images below to reach each program's download menu.
If you want to learn more about each program, visit them on the Programs page.

Learn more about QCEW
Visit QCEW Home


Learn more about LAUS
Visit LAUS Home

That's it! Ready to download a file? Visit the Program Complete Downloads to get started.
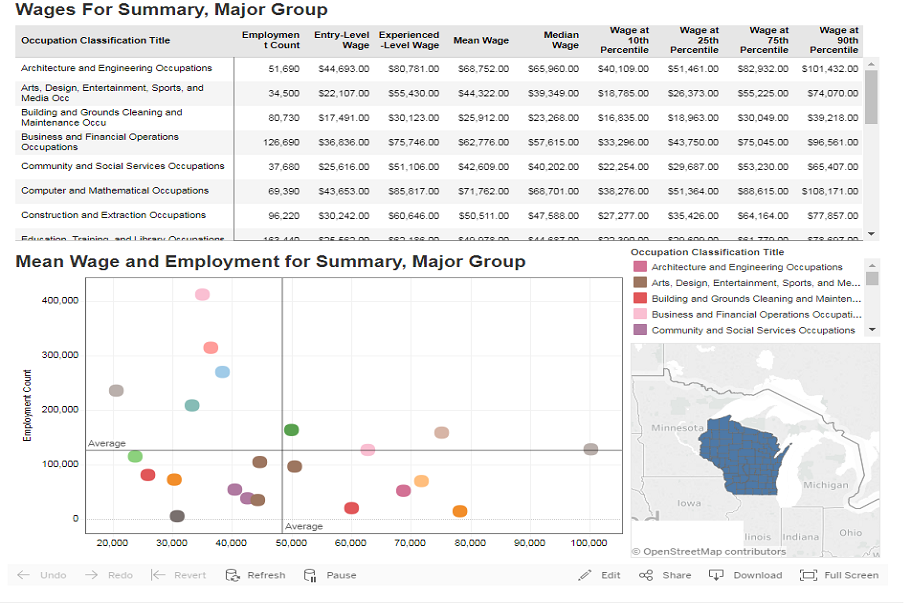
Tableau Program Visualizations
What are they?
They say a picture is worth a thousand words. With Tableau visualizations it's said to be worth rows and rows! Tableau puts data in to a picture perspective that makes data drill down easy with filters and click on features. The tool makes the data come alive and respond to a user's interaction.
Helpful Interactions
Identify which program visualization you would like to use. QCEW, CES, LAUS, or OES
View QCEW
Tableau
View QCEW
Tableau
View CES
Tableau
View CES
Tableau
View LAUS
Tableau
View LAUS
Tableau
View OES
Tableau
View OES
Tableau
- Click the button to go to the program visualization
- We recommend clicking "Full Screen" to work with the Tableau visualization. The button to expand
is in the lower right corner of the visualization.
- Filter the data in the Tableau viz and watch it change.
- Still not sure, learn more about Tableau by clicking the Help Page above each visualization or visit Tableau's help.
- All done with the visualization? Exit full screen view by the square in the bottom right corner of the visualization

Tableau is an interactive data tool. If you get stuck, click refresh and you can start over. There can be learning curves to overcome with Tableau but it's fun to learn. It will give you a new perspective on data!
Ready to go back to Program Tableau visualizaitons? Let's go back!
Site Map options:
- Department of Workforce Development offers both an alphabetical listing, as well as topical.
- Glossary of terms.
Job Openings?
Did you try the Job Center of Wisconsin? This on-line service provides current job openings as reported by employers throughout Wisconsin.
Did you try looking for jobs on Wisc.Jobs? This is the official employment site for Wisconsin State Government jobs.