Help
Questions?
If you can't find what you're looking for, feel free to Contact Us or you can email questions to JCWMyLMI@dwd.wisconsin.gov.
Frequenty Asked Questions (FAQs)
- Where can I find the data I'm looking for?
- Password and account questions?
- Is JavaScript turned on?
- How do I use the visualization tools I'm seeing on the website?
- How do I use the Data page?
- How can I contact my local economist?
- How do I find help from the LMI program teams?
- Can you tell me more about WDA, MSA, or BOS areas?
- I don't understand some of the terms used throughout the site.
- What's the green "Go Back" button I see at the bottom of my screen?
Educator and Parent Toolkit
The Educator and Parent Toolkit helps you navigate the tools at WisConomy and Job Center of Wisconsin.
Separation Methodology
Learn about the new Separation Methodology used for our Occupation Projections.
The Bureau of Workforce Information & Technical Support (WITS)
Looking for Labor Market Data?
Did you try the Data page and looking for more help?
Try the Data Search or download built data sets developed by our Program and Economist teams.
You can also subscribe to recieve email reports if that works better for you.
Need help with Tableau visualizations?
Did you try the Tableau Help page?
Site Map options:
- Department of Workforce Development offers both an alphabetical listing, as well as topical.
- Glossary of terms.
Find Talent and Jobs
Did you try the Job Center of Wisconsin? This on-line service provides current job openings as reported by employers throughout Wisconsin.
Did you try looking for jobs on Wisc.Jobs? This is the official employment site for Wisconsin State Government jobs.
Do need an internship or an intern? Try WisConnect! This is the official site matching internships with interns in Wisconsin.
Where can I find the data I'm looking for?
WisConomy has a variety of areas to access data. We have the Data page which allows custom queries and downloads. There are files built by our OEA Economists and Program teams to download here as well. You can go to the Visual Data page to work with interactive visualizations that can be customized with measures and filters. After you visualize the data you can create custom downloads or a pdf of the visualization to present.
Password and Account questions?
I forgot my password or need to make changes to my account.
Visit https://accounts.dwd.wisconsin.gov/ and click on Get Help. Complete the fields, and then click on the Submit button.
This can also be accessed by clicking on 'My Account' after logging on to Job Center of Wisconsin with your Username and existing Password, and then clicking 'Logon Management.'
Is my password case sensitive?
Yes. For example, disney123, DISNEY123 and Disney123 are all different passwords.
Is JavaScript turned on?
Most of the browsers in the world have JavaScript turned on (probably 95%). It is rare that someone would have it turned off. If they did, they probably want it that way. The WisConomy.com website works best with browsers that have JavaScript turned on (you could say that it is optimized for this).
The visualizations you will find throughout the website utilize JavaScript. To work with these you need JavaScript enabled.
Here are some resources for turning JavaScript on/off for various browsers: http://enable-javascript.com/
How do I use the visualization tools I'm seeing on the website?
There are many interactive visualizations throughout WisConomy.com. We have created a help section to get you started working with the tools.
DWD recommends using Google Chrome, Apple Safari, and Microsoft Edge in full screen on a desktop computer to view visualizations. More of these tools can be found on the Visual Catalog page. If you would like to create, save and share a visualization, go to the Data Tools page and Create Visualization. Visit the Help Page for assistance with the tools below.
How do I use the Data page?
You've found the tools and access to the data, but how do I use it? There is a help section designed to get you pointed in the right direction. If you have questions or comments you can email us at JCWMyLMI@dwd.wisconsin.gov
How can I contact my local economist?
You can reach out to your local economist by visiting the contact us page.
No sure where to look? Go to the Geography page to determine what area you are looking for.
How do I find help from the LMI program teams?
A good place to start researching the different parts of LMI is at the Programs page.
You can visit the Contact Us page to reach out with questions
Can you tell me more about WDA, MSA, or BOS areas?
WDA: The purpose of a local workforce development area (WDA) is to serve as a jurisdiction for the administration of workforce development activities and execution of adult, dislocated worker, and youth funds allocated by the State.
MSA: Wisconsin's Metropolitan Statistical Areas (MSA) is a geographic entity consisting of the county or counties associated with at least one urbanized area of at least 50,000 population, plus adjacent counties having a high degree of social and economic integration with the core as measured through commuting ties
BOS: The Balance of State (BOS) areas consist of counties that are not part of an MSA, and to the extent possible, contain contiguous counties that share a common economic base. Four statistical geographic entities consisting of counties not associated with or characterized by an urbanized area of at least 50,000 population, but share a high degree of social, industrial, and economic integration
I don't understand some of the terms used throughout the site.
Just getting started? We have created a glossary with releavant terms to help you navigate WisConomy.com.
You can also access the DWD Alphabetical Site Map to help find what you are looking for.
What's the green "Go Back" button I see at the bottom of my screen?
The green "Go Back" button that appears at the bottom of your screen allows you to quickly navigate back to the previous page you visited.
This allows you to quickly navigate back to the page you were just on and not be afraid to get lost.
Questions on the Data page?
You've started your research and want to know what resources you should use. We've consolidated our data resources in to one accessible location at the Data page. This page will give you more detail on each of the options available.
Data Search
What is it?
This is an advanced data query tool designed to enable the user to build a data set. You can drill in to the specific data that meets your requirements and then analyze how you choose data. When you finish the selections, a data set will appear below the search items.
Steps to complete the query:
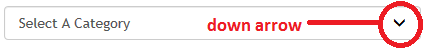
- Click the down arrow next to the "Select A Category" text. Below is an image of what the dropdown looks like in the data query.
- After making a selection, click on the screen to let the query know you are ready for the next selection option. You need to click outside of the dropdown menu to move to the next dropdown option.
- You will be prompted to select the next item in an additional dropdown menu.
- Once you have completed all of the selectable menu options, you will have a generate button appear to complete the query.
- At this point, you can view the data on your screen, download a csv file to analyze, or build a Tableau visualizaiton or "viz". You will be starting over if you work with the Create Visualization tab.
- You can download an Excel file layout/data dictionary that helps explain the data results.
Would you like to try it on the Data page? Select a Category from the Advanced Data Search dropdown to get started! Need more help?
Program Downloads
What are they?
These are downloadable csv or Excel files that have been individually structured by each of our LMI Program Analysts. If you want to learn more about each program, visit them here at the Programs page.
If you need more direction, do not hesitate to reach out to the individual program leads at the Contact Us page.
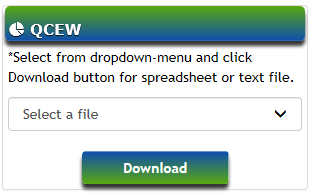
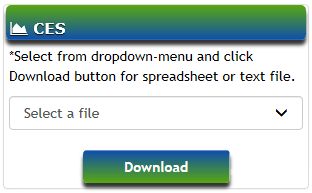
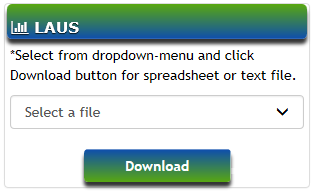
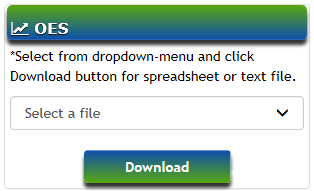
Steps to download files:
- Click the down arrow next to the "Select A File" text.
- Click the file you would like to download.
- Once you have selected a file to download left click the download button.
Identify which program data you would like to use: QCEW, CES, LAUS, or OES. You can click on the images below to reach each program's download menu.
If you want to learn more about each program, visit them on the Programs page.

Learn more about QCEW
Visit QCEW Home


Learn more about LAUS
Visit LAUS Home

That's it! Ready to download a file? Visit the Program Complete Downloads to get started.
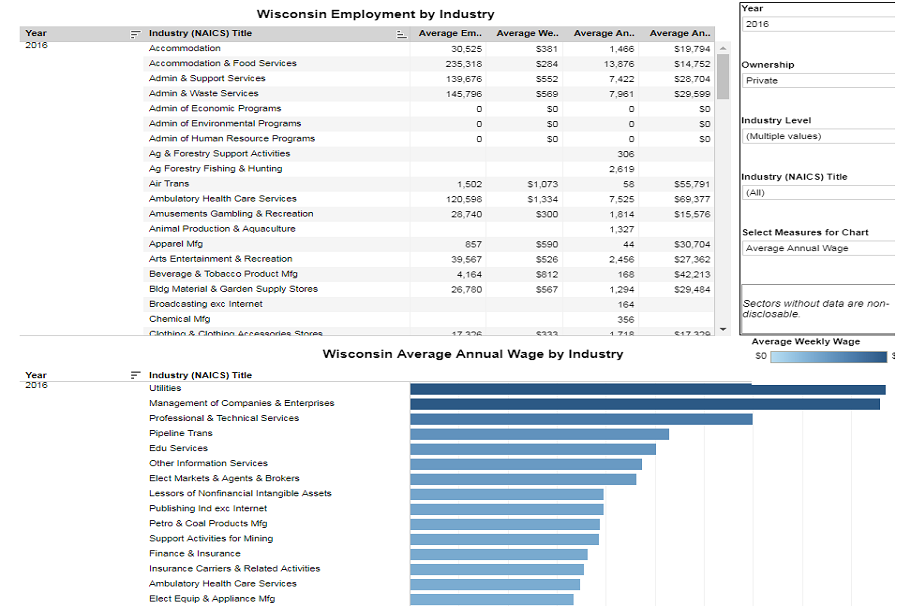
Tableau Program Visualizations
What are they?
They say a picture is worth a thousand words. With Tableau visualizations it's said to be worth rows and rows! Tableau puts data in to a picture perspective that makes data drill down easy with filters and click on features. The tool makes the data come alive and respond to a user's interaction.
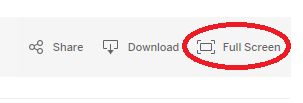
- Click the button to go to the program visualization
- We recommend clicking "Full Screen" to work with the Tableau visualization. The button to expand
is in the lower right corner of the visualization.
- Filter the data in the Tableau viz and watch it change.
- Still not sure, learn more about Tableau by clicking the Help Page above each visualization or visit Tableau's help.
- All done with the visualization? Exit full screen view by the square in the bottom right corner of the visualization

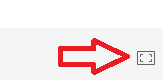
Tableau is an interactive data tool. If you get stuck, click refresh and you can start over. There can be learning curves to overcome with Tableau but it's fun to learn. It will give you a new perspective on data!
Helpful Interactions
Identify which program visualization you would like to use. QCEW, CES, LAUS, or OES
View QCEW
Tableau
View QCEW
Tableau
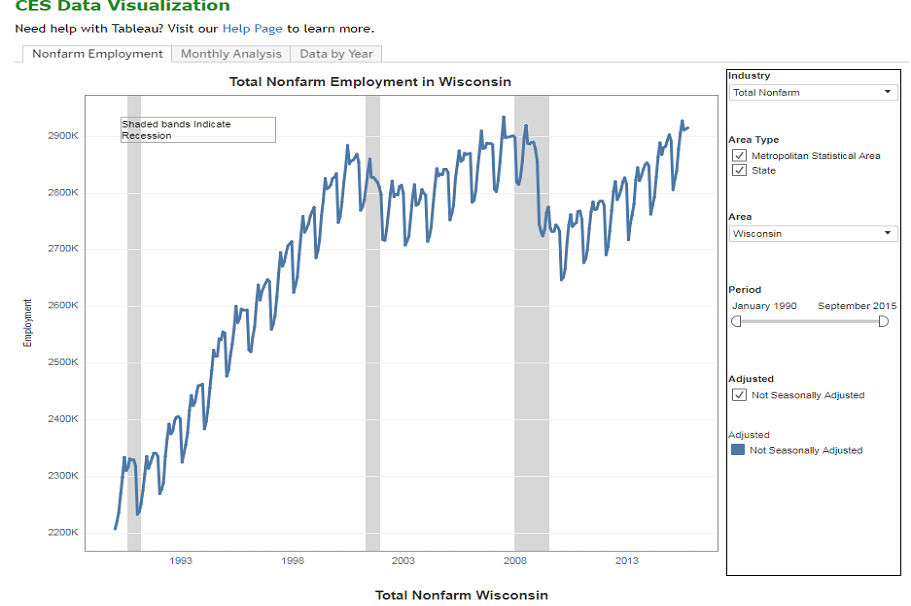
View CES
Tableau
View CES
Tableau
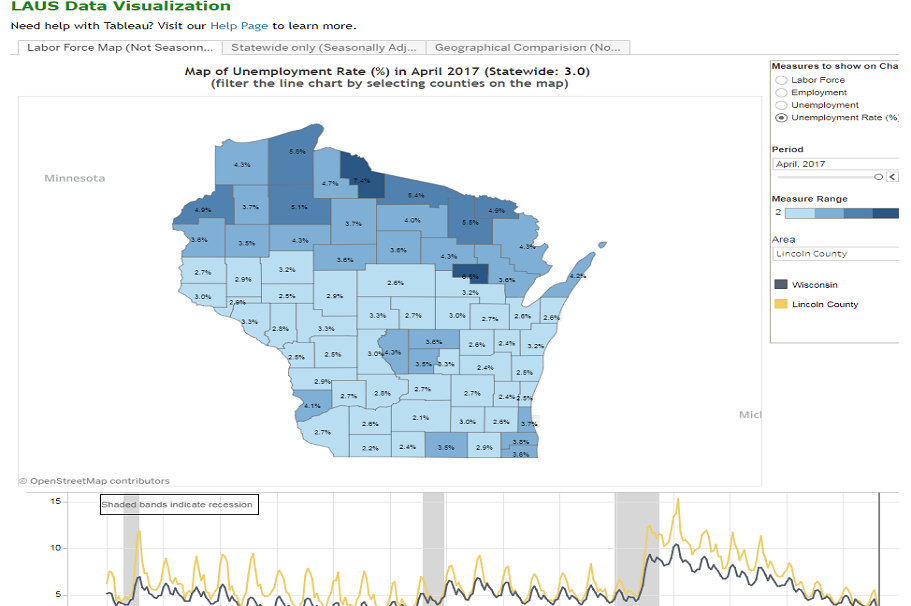
View LAUS
Tableau
View LAUS
Tableau
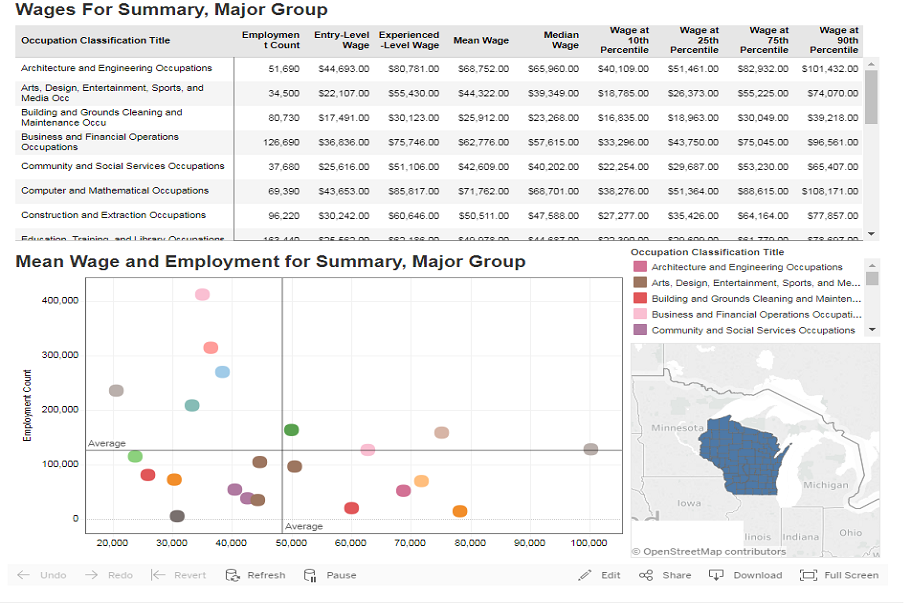
View OES
Tableau
View OES
Tableau
Tableau Help

The Tableau Help Page is here to give you a better understanding of how to use the visualizations within the Labor Market Information (LMI) website. The Tableau tool allows users to visually interact with and customize data views. We've included some helpful suggestions to assist with a new user's experience within Tableau.
There are many resources to help users learn the power of data visualization. Tableau is one tool that helps analyze data in a visual manner. You can visit Tableau Public to see many examples of the tool used to create interactive data analysis.
Tableau is a third-party software not endorsed or recommended by the State of Wisconsin. The information is provided to help the public utilize the Tableau visualizations that are integrated into this website.
For more help, visit Tableau's Help Page.
Interactions
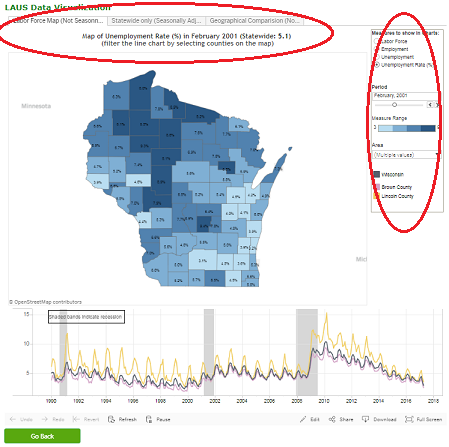
Tableau visualizations will typically have more than one filter interaction to work with. The dashboards are built by our analysts to help interact with the data they work with from a visual perspective. You can select more than one filter to modify the output within each visualization or select a tab at the top of the dashboard to open a different view.
How to Print:
- At the bottom of each Tableau dashboard there is a download button.

- When you left-click a selection menu will open. Here you can select PDF or Image by left-clicking your choice.
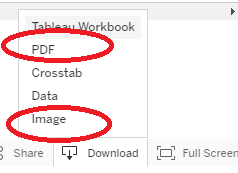
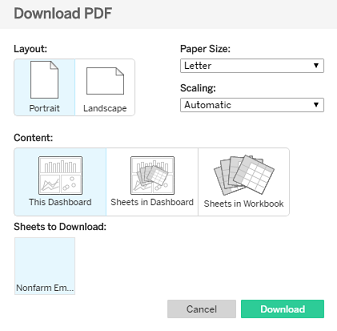
- The image selection will allow you to download a .png file of the current sheet selected in the
dashboard. If you select PDF you can choose to download the dashboard, all of the sheets in the dashboard, or
all of the sheets in the workbook. In addition, you can select portrait or landscape print format, and make
adjustments to your scaling if you would like.
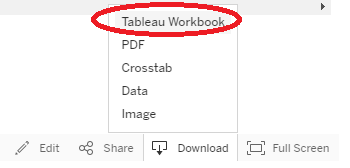
Downloading a Tableau workbook is easy. At the bottom of the visualizations you will left-click on download and left-click Tableau Workbook. You will need Tableau software to work with the workbook.
- To start sorting data within a view, click on the sort button. The sort buttons on an axis will create a sort that works with the view.
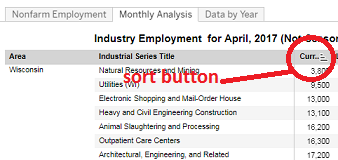
- Not all views will have a sort button available depending on the data.
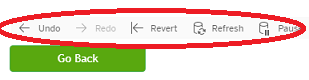
- On the bottom left of all views there is the option to undo, redo, revert, or refresh changes in the view.
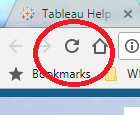
- You may need to refresh your browser if the view stalls. In Chrome, you need to left-click the circle arrow at the top left of the screen. This will refresh the page and the Tableau viz.
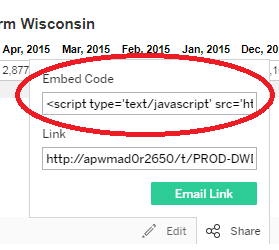
- There are several options to embed custom Tableau Visualizations within a website. The first is to embed the link. The link address for each view is at the bottom right of each dashboard. Click on the share icon at the bottom of the view.
- After the dialog box opens, copy and paste the http:// link for the view.
- You can also embed the javascript code within a custom page. This should be done by your webmaster.

There is a large amount of data to view and at times it's hard to fit on a mobile screen or even a webspace. You may want to take the view to Full Screen! This can be accomplished with a click of the mouse.
- On the bottom right of each viz there is an option to click "Full Screen".
- You can then leave Full Screen by clicking the box in the lower right corner of your screen.