Nurse Survey Review 2025
Executive Summary
This report presents findings from the 2024 Wisconsin Registered Nurse Survey (WRNS) and the 2025 Wisconsin Licensed Practical Nurse Survey (WLPNS), both administered by the Wisconsin Department of Safety and Professional Services (DSPS) as a requirement for license renewal. In accordance with Wis. Stat. s. 106.30, the Department of Workforce Development (DWD) compiles these data to help policymakers assess the supply, demand, and turnover of nurses, identify regional or specialty shortages, and understand barriers to entering the nursing profession in Wisconsin.

RN Details
After eliminating incomplete and unusable surveys, the final sample included 93,008 RNs.
- After eliminating incomplete and unusable surveys, the final sample included 87,100 RN surveys.
- Of the remaining usable surveys, 81,098 (87.2%) were employed as RNs, while 1,267 (1.4%) were either unemployed or were not currently working but actively looking for work in nursing.
- 60,056 (74.1%) of the sample did not change primary employment position in the year before completing the survey. For those who did change employment positions, the most common reason was dissatisfaction with a previous position, followed by retirement, and promotion/career advancement.
- Around half (47,227 or 51.3%) of the RN sample reported holding a bachelor degree in nursing or a related field as their highest level of education. Another 23,940 (26.0 %) reported holding an associate degree in nursing or a related field. A total of 34,055 RNs (36.6%) indicated they took out student loans to support their nursing education, while 9,680 (10.4%) reported having student loans for other types of education.
- In 2024, a total of 7,576 nurses were working as Advanced Practice Registered Nurses (APRNs). Overall, 9,130 nurses held at least one national board certification as an APRN, recognizing that some nurses may hold more than one certification. Of these, 7,545 (82.6%) were Nurse Practitioners (NP), 1,007 (11.0%) were Certified Registered Nurse Anesthetists (CRNA), 378 (4.1%) were Clinical Nurse Specialists (CNS), and 285 (3.1%) were Certified Nurse Midwives (CNM). In addition, 8,562 nurses were credentialed as Advanced Practice Nurse Prescribers (APNPs), of whom 7,466 (87.2%) were working in Wisconsin. (NP).
LPN Details
Licensed Practical Nurses (LPN) responding to the online survey: 9,207.
- After eliminating incomplete and unusable surveys, the final sample includes 7,845 LPN surveys.
- Of the remaining usable surveys, 7,631 (87.9%) were employed as LPNs and 206 (2.4%) were either unemployed or not currently working but actively looking for work in nursing. 5,589 (73.2%) LPNs of the sample did not change employment position in the year before completing the survey. For those who did change employment positions, the most common reason was retirement,
- Most LPNs reported their highest level of education to be either a diploma in nursing or a vocational nursing degree (87.4%). 734 (8.7%) had an associate degree in nursing or a related field. 1,847 LPNs (21.3%) indicated they had student loans to support their nursing education, 1,374 (15.8%) reported having student loans for both nursing and other types of education, and 5,228 (60.2%) indicated they had no student loans.
Highlights
Overall, the nurse workforce population is not as diverse as the Wisconsin population at large.
- The nursing workforce is dominated by women, with 91.5% of RNs and 93.0% of LPNs reported to be women. By comparison, women make up 47.3% of Wisconsins overall workforce, according to 2019-2023 American Community Survey (ACS) 5-year estimates.
- Both RNs and LPNs were, on average, older than Wisconsins overall workforce. The average age was 46 for RNs and 49 for LPNs. By comparison, the states overall workforce averaged 44 years of age, according to ACS data.
- Racial and ethnic composition differed between LPNs and RNs. Among survey respondents, 81.6% of LPNs were White, and 4.3% were Hispanic, Latino, or Latinx, while 92.7% of RNs were White, and 7.1% were Hispanic, Latino, or Latinx. By comparison, ACS 5-year data for Wisconsin reported 83.7% of the population as White and 6.8% as Hispanic, Latino, or Latinx.
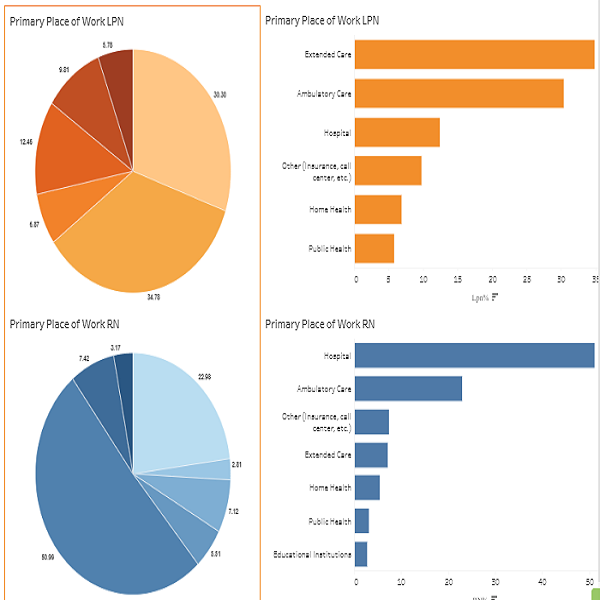
- Most RNs worked in hospitals (52.3%), followed by ambulatory care (21.1%). In contrast, the majority of Advanced Practice Nurse Prescribers (APNP) were employed in ambulatory care (45.0%), with a smaller share reported to be working in hospitals (38.1%). The most common principal place of work for LPNs was extended care facilities (39.3%), followed by the ambulatory care setting (27.5%).
- The number of RNs who reported using Artificial Intelligence (AI) at their primary place of work is 3,736 (4.6%). Among these RNs, 51.0% said their productivity was about the same as before AI implementation, 43.7% reported it was better or much better, and 5.2% reported it was worse or much worse. Among LPNs, 174 (2.3%) reported using AI at their primary place of work. Of these LPNs, 55.2% said their productivity was about the same as before using AI, 37.9% reported it was better or much better, and 7.0% reported it was worse or much worse. The number of RNs who reported using Artificial Intelligence (AI) at their primary place of work is 3,736 (4.6%). Among these RNs, 51.0% said their productivity was about the same as before AI implementation, 43.7% reported it was better or much better, and 5.2% reported it was worse or much worse. Among LPNs, 174 (2.3%) reported using AI at their primary place of work. Of these LPNs, 55.2% said their productivity was about the same as before using AI, 37.9% reported it was better or much better, and 7.0% reported it was worse or much worse.s
Introduction & Survey Methods
Nurses are essential providers for patient care. In 2024, more than 3.28 million nurses were employed in the U.S., making nursing the largest category of healthcare professionals. Over the past 20 years, the Registered Nurse (RN) workforce has faced recurring staffing challenges driven by the aging population, limited nursing school faculty, and increasing retirements, all of which have placed sustained pressure on the healthcare system. Although recent research suggests that the U.S. nursing workforce is beginning to recover since the pandemic, its long-term stability remains uncertain, and high levels of stress and burnout persist despite some improvement in emotional exhaustion and workloads since 2022.
Recent data show increases in student enrollment across most undergraduate and graduate programs at U.S. nursing schools, reversing earlier downward trends. In Wisconsin, this pattern is evident in the growth of first-time National Council Licensure Examination (NCLEX) test-takers, which increased from 1,795 in 2003 to 4,068 in 2024. Nationally, employment of registered nurses is projected to grow 5% from 2024 to 2034, faster than the average for all occupations. An average of 189,100 openings is expected each year, largely due to the need to replace workers who transfer to different occupations or exit the labor force, such as to retire.
The State of Wisconsin is committed to monitoring both the supply of and demand for nurses, while also ensuring the continued delivery of high-quality healthcare. Since 2010, Wisconsin Statute 106.30 has required surveys of registered nurses (RNs) in even-numbered years through the Wisconsin Registered Nurse Survey (WRNS) and of licensed practical nurses (LPNs) in odd-numbered years through the Wisconsin Licensed Practical Nurse Survey (WLPNS). Conducted as part of the license renewal process, these surveys gather information on the characteristics of nurses licensed throughout the state.
The Department of Workforce Development (DWD) collects and analyzes the results of these two surveys biennially to provide insights into the demographics, employment, education, and growth of Wisconsins nursing workforce. Since 2010, parallel with this legislative report, DWD also produces a biennial RN supply and demand forecast. The most recent forecast, covering 2022 to 2040, projects a flat supply of RNs alongside rapidly increasing demand, resulting in a projected shortfall of 26% (19,190 RNs) by 2040. In addition, the Wisconsin Center for Nursing (WCN) conducts an indepth analysis on the survey data to further inform workforce planning and policy development. The Office of Economic Advisors (OEA) also uses the data to develop academic papers for submission to peer-reviewed journals, expanding the research impact beyond policy into the broader academic and healthcare workforce research communities.
The Wisconsin Department of Safety and Professional Services (DSPS) is responsible for licensing healthcare providers in Wisconsin. As part of the licensing and renewal process, RNs and LPNs must complete the WRNS and WLPNS. The surveys collect data on nurses who live and/or work in Wisconsin. The information is organized into the following sections:
- Licensing, Education and Training
- Impact of COVID-19
- Artificial Intelligence (AI)
- Current Employment Status
- Nursing Specialization Information
- Advance Practice Nursing (only included in the RN survey)
- Demographics
The 2024 WRNS includes 106,031 completed surveys. After eliminating incomplete and unusable observations, the final RN sample includes 93,008 surveys. The 2025 WLPNS includes 9,207 surveys. After removing incomplete and unusable data, the final sample includes 8,683 surveys.
Summary
The purpose of this report is to summarize key findings from the 2024 Wisconsin Registered Nurse Survey (WRNS) and the 2025 Wisconsin Licensed Practical Nurse Survey (WLPNS). While these surveys provide valuable descriptive data on the responses of Wisconsin RNs and LPNs, they alone cannot predict the extent of any potential nursing shortage in the state. Additional research is currently being undertaken by the Office of Economic Advisors (OEA) at the Wisconsin Department of Workforce Development (DWD) regarding demand for and supply of RNs, along with different characteristics of the nursing workforce.
Further analysis of past and future survey results, together with other factors influencing the labor market, will be essential to continue developing informed strategies and policies that address Wisconsin nursing workforce needs. If you have questions about this report or need additional information regarding the surveys, please contact:
Maria del Pilar Casal, PhD
Research Analyst Senior
(608) 733-3859
Licensing & Employment
Most of the tables in this report are based on the final clean sample, which includes responses from 93,008 RNs and 8,683 LPNs working and/or living in Wisconsin. The sample sizes for some tables may vary due to the nature of the question.
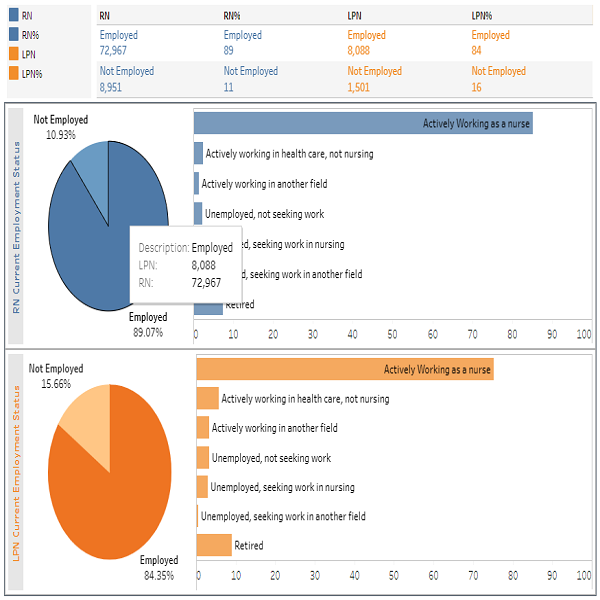
The chart below displays frequencies and percentages for questions about employment status and factors related to employment changes. Considering current employment status, 87.2% of RNs, and 87.9% of LPNs were employed. Of those employed, most of them worked in the nursing field: 82.8% of RNs and 79.4% of LPNs. Another 1.4% of RNs and 2.4% of LPNs were not employed but were seeking work in nursing, while 8.6% of RNs and 6.9% of LPNs were retired.
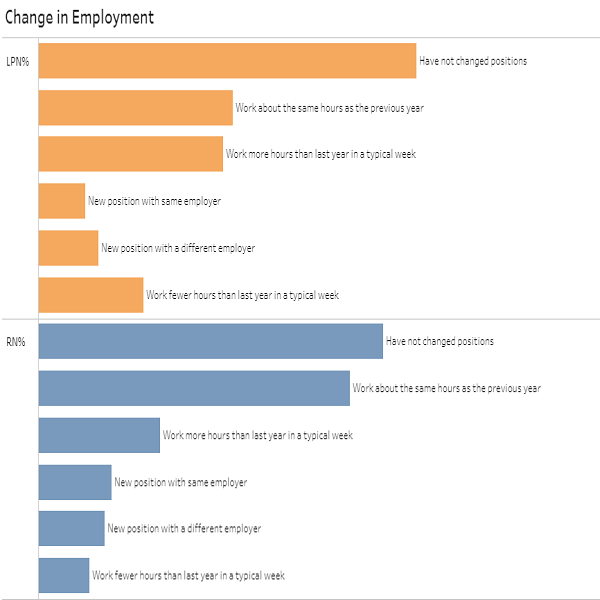
Additionally, 74.1% of the RN sample and 73.2% of the LPN sample reported no change in employment status in the year before completing the survey. For RNs, 11.2% reported a new position with the same employer, 11.6% reported a new position with a different employer, and 3.2% reported the same position with a different employer. For LPNs, 8.1% reported a new position with the same employer, 13.0% reported a new position with a different employer, and 5.7% reported the same position with a different employer. In total, 64.2% of RNs and 63.1% of LPNs worked about the same hours as the year before completing the survey. Only 12.3% of RNs and 14.8% of LPNs indicated that they worked fewer hours, while 23.5% of RNs and 22.1% of LPNs worked more hours in a typical week.
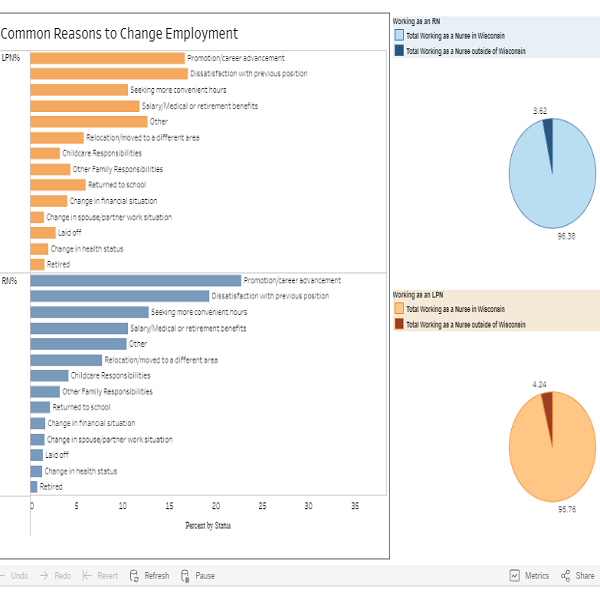
The most common reasons RNs cited for changing their positions included dissatisfaction with the prior position, (15.5%) followed by retirement (13.5%) and promotions and career advancement (12.3%). For LPNs, the top reasons were retirement (18.7%), dissatisfaction with the previous position (13.4%), and salary/medical or retirement benefits (12.3%).
A total of 71,266 (92.5%) of the RNs and 6,703 (97.2%) of LPNs reported that they work as a nurse in Wisconsin. Of those working in Wisconsin, 83.1% of the RNs and 91.8% of the LPNs provided direct patient care. Direct patient care (DPC) is defined as administering nursing care one-onone to patients, the ill, the disabled, or clients in the hospital, clinic, or other patient care setting.
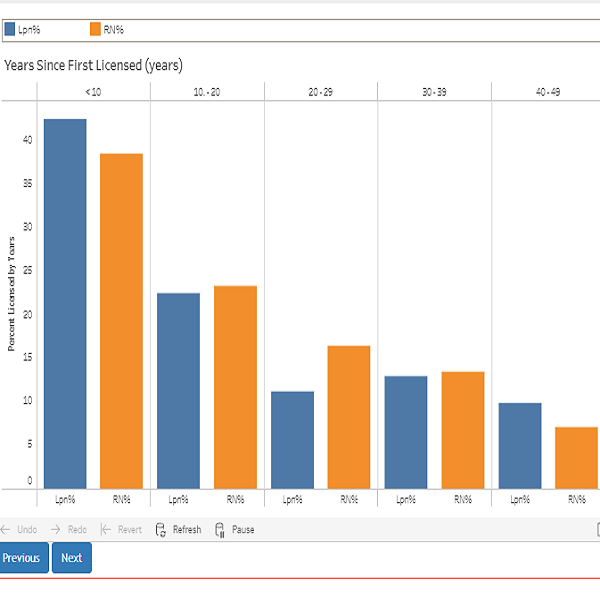
Of those surveyed, 37.2% of RNs and 41.2% of LPNs had their license for less than 10 years.
Demographics & Education
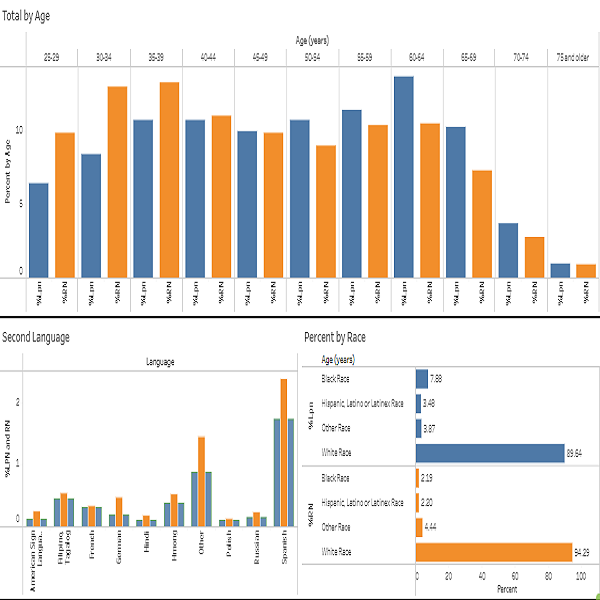
Overall, the nursing survey population is not as diverse as the general labor force in Wisconsin. The RN and LPN workforce continue to be dominated by women, who represented 91.5% of RNs and 93.0% of LPNs. Women represented 47.4% of the Wisconsin labor force in the same time period.
Both the RN and LPN survey populations are generally older than the Wisconsin labor force at large. The average age of the RN workforce was 46 years, and the median age was 44 years. The average age of the LPN workforce was 49 years, and the median age was 48 years old. In comparison, the ACS for Wisconsin reported an average and median age of 44 years. In general, the RN population is younger than the LPN population. Table 3 shows 26.1% of RNs were between 30 and 40 years old, compared to 19.2% of LPNs. Considering the baby boomer population (born between 1946 and 1964), 20.0% of RNs and 24.2% of LPNs were between 60 and 75 years of age. The percentage of this older population has increased in the nursing field, which has significant implications for workforce planning. Note that only the nurses renewing their licenses are required to complete the survey, and this could explain in part the disparity between the overall Wisconsin and nursing percentage of the labor force of RNs and LPNs under the age of 25.
Overall, the racial and ethnic makeup of the nursing labor force differs from that of Wisconsin broader workforce. LPNs had more representation of racial and ethnic minority groups than RNs. Table 3 shows that 81.6% of LPNs were White, 11.1% were Black, and 4.3% were Hispanic, Latino, or Latinx. By comparison, 92.7% of RNs were White, 2.9% were Black, and 7.1% were Hispanic, Latino, or Latinx. In the Table 2. RNs and LPNs Working and Providing Direct Patient Care Table 3. Demographic Characteristics total Wisconsin labor force, 83.7% of workers were White, 5.0% were Black, and 6.8% were Hispanic, Latino, or Latinx. Most of the nursing workforce resided in Wisconsin (96.2% of RNs and 96.7% of LPNs).
Although 93.6% of RNs and 92.5% of LPNs reported English proficiency, a wide range of languages were spoken. The main second language in the nursing workforce is Spanish; the proportion of Spanish speaking nurses was 2.4% for RNs and 3.3% for LPNs.
Education and ongoing training are essential for RNs and LPNs to deliver high-quality care across a wide range of settings and situations. The education requirements for RNs and LPNs differ. Most RNs are required to hold at least an associate degree, while LPNs typically complete a postsecondary non-degree program. As a result, most LPNs (87.4%) have less than an associate degree, whereas the opposite is true for RNs. Over the past 15 years, the educational attainment of the RN workforce in Wisconsin has increased significantly. In 2010, 88.0% of the RN sample had an associate degree or higher, compared to 96.4 % in 2024. In 2024, 26.0% of RNs held an associate degree, 51.3% a bachelor degree, 16.2% a master degree, and 2.9% a doctoral degree as their highest level of education.
78.3% of RNs and 69.0% of LPNs reported no plans to pursue further nursing education. However, 15.3% of RNs and 19.1% of LPNs planned to continue their education within the next two years. Among RNs planning to pursue further education, 37.3% intended to enroll in a bachelor program and 33.9% in a master program. In comparison, 63.3% of LPNs planned to pursue a bachelor degree during the same period. Additionally, 6.4% of RNs and 12.0% of LPNs were already engaged in further studies. When asked about barriers to continuing education, the primary challenge for RNs was the cost of tuition and materials (35.6%), followed by the cost of lost work time and benefits (22.8%). For LPNs, the top barrier was the cost of lost work time and benefits (33.3%), followed by tuition and materials (30.1%).
| Education and Training of Registered Nurses and Licensed Practical | RN | RN % | LPN | LPN % |
|---|---|---|---|---|
| Education (Highest Nursing or Related Field Degree) | 92,134 | 100 | 8,432 | 100 |
| Diploma in Nursing or Vocational Nursing | 3,361 | 3.7 | 7,371 | 87.4 |
| Associate Degree | 23,940 | 26 | 734 | 8.7 |
| Bachelor Degree | 47,227 | 51.3 | 265 | 3.1 |
| Master Degree | 14,951 | 16.2 | 56 | 0.7 |
| Doctorate | 2,655 | 2.9 | 6 | 0.1 |
| Enrollment Plans for Future Education | 93,008 | 100 | 8,683 | 100 |
| No plans | 72,788 | 78.3 | 5,991 | 69 |
| Associate program | N/A | N/A | 845 | 9.7 |
| BSN program | 1,980 | 2.1 | 164 | 1.9 |
| MSN program | 2,098 | 2.3 | N/A | N/A |
| Master's program (related health field) | 309 | 0.3 | N/A | N/A |
| DNP program | 966 | 100 | N/A | N/A |
| Nursing PhD program | 87 | 0.1 | N/A | N/A |
| PhD program (related field) | 44 | 0.1 | N/A | N/A |
| Graduate program in Nursing | N/A | N/A | 10 | 0.1 |
| Non-degree certification program | 476 | 0.5 | 18 | 0.2 |
| Plan to pursue further education within two years | 14,260 | 15.3 | 1,655 | 19.1 |
| Further Education Next Two Years | 14,260 | 100 | 1,655 | 100 |
| Bachelor Degree | 5,324 | 37.3 | 1,048 | 63.3 |
| Master Degree | 4,831 | 33.9 | 19 | 1.2 |
| Doctorate | 2,619 | 18.4 | 55 | 3.3 |
| Other | 1,486 | 10.4 | 533 | 32.2 |
| Challenges to further education (select top two) * | 93,008 | 100 | 8,683 | 100 |
| Cost of tuition, materials, books, etc | 33,104 | 35.6 | 2,616 | 30.1 |
| Cost of lost work time and benefits | 21,230 | 22.8 | 2,893 | 33.3 |
| Family/personal reasons | 18,626 | 2 | 1,453 | 16.7 |
| Lack of flexibility in work schedule | 7,213 | 7.8 | 918 | 10.6 |
| Scheduling of educational programs offered | 1,344 | 1.5 | 274 | 3.2 |
| Commuting distance to education program | 931 | 100 | 216 | 2.5 |
| Limited access to online learning | 423 | 0.5 | 223 | 2.6 |
| Other | 2,456 | 2.6 | 315 | 3.6 |
| N/A | 13,625 | 14.7 | 1,408 | 16.2 |
| Student Loans to support | 93,008 | N/A | 8,683 | N/A |
| Nursing education | 34,055 | 36.6 | N/A | N/A |
| Only nursing education | N/A | N/A | 1,847 | 21.3 |
| Other education | 9,680 | 10.4 | N/A | N/A |
| Only other education | N/A | N/A | 234 | 2.7 |
| Both nursing and other education | N/A | N/A | 1,374 | 15.8 |
| No student loans | N/A | N/A | 5,228 | 60.2 |
| *Totals greater than 100% due to multiple choices. Calculated as % of respondents. | ||||
| N/A = Data not collected for this category |
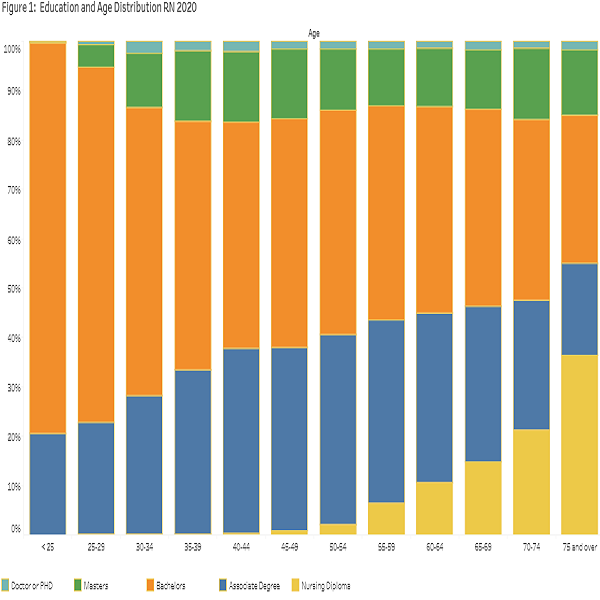
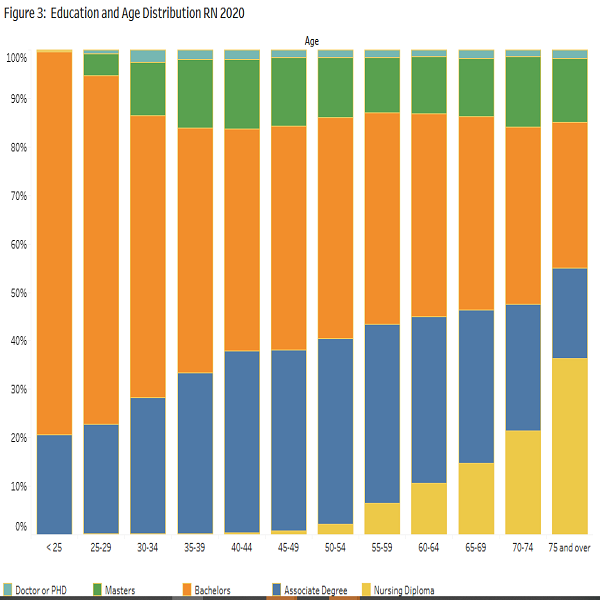
The chart shows the relationship between the education and age of RNs.
The RNs' figure shows increased educational attainment for younger RNs. The older the RNs, the higher the percentage with a nursing diploma. Those in the middle age range (35 to 60 years old) have a higher proportion of associate degrees. A bachelor's degree is the norm in the younger age range. The proportion of RNs with master's and PhD's in nursing, or a related field, is uniform across the different age groups.
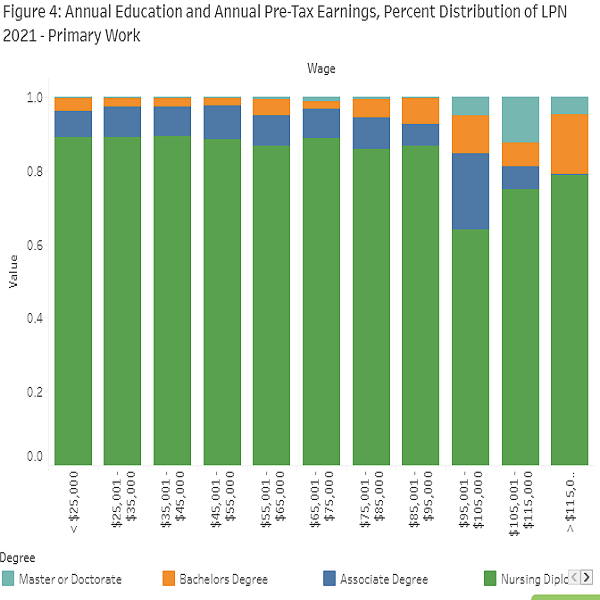
The LPNs' figure shows a u-shape for the percentage of LPNs with a nursing diploma, with the higher percentage in the case of younger than 25 and older than 65. Those LPNs in the middle age range (25 to 60 years old) have a higher proportion of associate degrees. The proportion of those with bachelor's, master's, and PhD's in nursing or related field is uniform across the different age groups of LPNs.
Work & Specialization
The following charts display information about specialized knowledge or experience; primary work setting; and telehealth and remote work at their primary place of employment.
The tables below show the clinical areas in which RNs and LPNs have specialized knowledge and/or experience of two or more years. For RNs, Medical-Surgical (26.7%) and Acute Care/Critical Care/ Intensive Care (25.1%) led the way, followed by Adult Health (15.0%); Geriatrics/Gerontology (14.9%), and Surgery/Pre-op/Post-op/PACU (14.1%). For LPNs, the largest share was in Geriatrics/Gerontology (47.0%), followed by Adult Health (23.2%), Family Health (19%), Hospice Care/Palliative Care (18.7%), and Home Health (17.2%).
| RN Specialized Knowledge or Two or more years' experience | Total | Percent |
|---|---|---|
| Total RN | 93,008 | 100 |
| Medical-Surgical | 24,852 | 26.7 |
| Acute Care/Critical Care/Intensive Care | 23,338 | 25.1 |
| Adult Health | 13,960 | 15.0 |
| Geriatrics / Gerontology | 13,871 | 14.9 |
| Surgery/Pre-op/Post-op/PACU | 13,093 | 14.1 |
| Cardiac Care | 12,917 | 13.9 |
| Emergency/Trauma | 11,620 | 12.5 |
| Hospice Care/Palliative Care | 9,581 | 10.3 |
| Home Health | 8,418 | 9.1 |
| Pediatrics | 8,215 | 8.8 |
| Family Health | 7,163 | 7.7 |
| Psychiatric/Mental Health | 6,810 | 7.3 |
| Oncology | 6,480 | 7.0 |
| nan | 6,458 | 6.9 |
| Labor and Delivery | 5,951 | 6.4 |
| Obstetrics/Gynecology | 5,474 | 5.9 |
| Community Health | 4,971 | 5.3 |
| Maternal-Child Health | 4,882 | 5.3 |
| Rehabilitation | 4,879 | 5.3 |
| Women's Health | 4,681 | 5.0 |
| Neonatal Care | 4,274 | 4.6 |
| Addiction/AODA/Substance Abuse | 3,247 | 3.5 |
| Dialysis/Renal | 3,074 | 3.3 |
| Public Health | 3,047 | 3.3 |
| Respiratory Care | 2,332 | 2.5 |
| School Health (K-12 or post-secondary) | 2,202 | 2.4 |
| Anesthesia | 2,098 | 2.3 |
| Occupational Health/Employee Health | 1,971 | 2.1 |
| Corrections | 1,844 | 2.0 |
| Nephrology | 1,125 | 1.2 |
| Parish/Faith Community | 472 | 0.5 |
| Other, not listed | 13,561 | 14.6 |
| *Totals may exceed 100% due to multiple responses; calculated as % of respondents. |
| LPN Specialized Knowledge or Two or more years' experience | Total | Percent |
|---|---|---|
| Total LPN | 8,683 | 100 |
| Geriatrics/Gerontology | 4,078 | 47.0 |
| Adult Health | 2,010 | 23.2 |
| Family Health | 1,652 | 19.0 |
| Hospice Care/Palliative Care | 1,621 | 18.7 |
| Home Health | 1,495 | 17.2 |
| Rehabilitation | 1,334 | 15.4 |
| Medical - Surgical | 1,050 | 12.1 |
| Pediatrics | 879 | 10.1 |
| Psychiatric / Mental Health | 783 | 9.0 |
| Acute Care/Critical Care/Intensive Care | 753 | 8.7 |
| Corrections | 574 | 6.6 |
| Community Health | 558 | 6.4 |
| Women's Health | 474 | 5.5 |
| Addiction/AODA/Substance Abuse | 464 | 5.3 |
| Cardiac Care | 439 | 5.1 |
| Obstetrics/Gynecology | 412 | 4.7 |
| Respiratory Care | 374 | 4.3 |
| Surgery/Pre-op/Post-op/PACU | 373 | 4.3 |
| Emergency/Trauma | 336 | 3.9 |
| Occupational Health/Employee Health | 330 | 3.8 |
| School Health (K-12 or post-secondary) | 302 | 3.5 |
| Oncology | 255 | 2.9 |
| Dialysis/Renal | 221 | 2.6 |
| Public Health | 196 | 2.3 |
| Labor and Delivery | 157 | 1.8 |
| Maternal-Child Health | 150 | 1.7 |
| Nephrology | 83 | 1.0 |
| Neonatal Care | 55 | 0.6 |
| Anesthesia | 21 | 0.2 |
| Other, not listed | 1,311 | 15.1 |
The tables below show the specialties in which RNs and LPNs hold current national board certifications. 24.1% of RNs and 28.0% of LPNs reported that they were board certified in a medical specialty. The top specialty areas for RNs were Family Health, Acute Care/Critical Care, Oncology Nursing (OCN®, CPON®, CBCN, AOCNP®, AOCNS®), Medical Surgical Nursing, and Emergency Nursing (CEN®, CFRN®). The top national board certifications for LPNs were IV Certification, Geriatrics/Gerontology, Wound Care, and Emergency Medicine.
| RN Top Medical Certifications | Total | Percent |
|---|---|---|
| Total RN | 93,008 | 100 |
| Not certified | 70,619 | 75.9 |
| Family Health | 2,446 | 2.6 |
| Acute Care/Critical Care | 2,251 | 2.4 |
| Oncology Nursing (OCN®, CPON®, CBCN, AOCNP®, AOCNS®) | 1,316 | 1.4 |
| Emergency Nursing (CEN®, CFRN®) | 1,009 | 1.1 |
| Anesthesia (CRNA) | 969 | 1.0 |
| Medical-Surgical Nursing | 955 | 1.0 |
| Wound/Ostomy Nursing (CWOCN, CWCN, COCN, CCCN, CWON) | 953 | 1.0 |
| Pediatric Nursing | 896 | 1.0 |
| OB/GYN/WomenÂ’s Health Care | 878 | 0.9 |
| Adult Health | 836 | 0.9 |
| Peri-Operative (CNOR®) | 745 | 0.8 |
| Gerontological Nursing | 617 | 0.7 |
| Case Management Nursing | 612 | 0.7 |
| Medical-Surgical Nursing (CMSRN®) | 542 | 0.6 |
| Neonatal | 474 | 0.5 |
| Psychiatric & Mental Health Nursing-Advanced (APMHN) | 453 | 0.5 |
| Psychiatric & Mental Health Nursing | 443 | 0.5 |
| Hospice and Palliative Nursing (CHPN®, ACHPN®) | 415 | 0.5 |
| General Nursing Practice | 410 | 0.4 |
| Cardiac-Vascular Nursing | 393 | 0.4 |
| Perianesthesia (CPAN®, CAPA®) | 237 | 0.3 |
| Nurse Educator (CNE) | 234 | 0.3 |
| Ambulatory Care Nursing | 198 | 0.2 |
| Community Health | 197 | 0.2 |
| Diabetes Management - Advanced | 183 | 0.2 |
| Orthopedic Nursing (ONC®) | 175 | 0.2 |
| Home Health Nursing | 167 | 0.2 |
| Public/Community Health | 164 | 0.2 |
| Respiratory/Pulmonary Care | 161 | 0.2 |
| Nursing Professional Development | 146 | 0.2 |
| Rehabilitation (CRRN®) | 143 | 0.2 |
| Nursing Case Management | 136 | 0.2 |
| Nurse Executive (CENP) | 131 | 0.1 |
| Perinatal Nursing | 129 | 0.1 |
| Transplant | 124 | 0.1 |
| School Nursing | 117 | 0.1 |
| Occupational Health (COHN) | 111 | 0.1 |
| Parish Nurse | 108 | 0.1 |
| Neurology (CNRN) | 102 | 0.1 |
| Nurse Manager and Leader (CNML) | 99 | 0.1 |
| Pain Management | 97 | 0.1 |
| Gastroenterology (CGRN) | 91 | 0.1 |
| Nurse Executive - Advanced | 91 | 0.1 |
| School Nursing (NCSN®) | 85 | 0.1 |
| Nephrology (CNN, CDN) | 77 | 0.1 |
| Addiction/AODA | 74 | 0.1 |
| Informatics Nursing | 74 | 0.1 |
| Infusion Nursing (CRNI) | 61 | 0.1 |
| High-Risk Perinatal Nursing | 53 | 0.1 |
| Cardiac Rehabilitation Nursing | 44 | 0.1 |
| Radiology/Invasive Procedures Lab | 43 | 0.1 |
| Legal Nurse Consultant (LNCC®) | 36 | 0.04 |
| Domestic Violence/Abuse Response | 26 | 0.03 |
| Family Planning | 20 | 0.02 |
| Public Health Nursing-Advanced (APHN) | 14 | 0.02 |
| College Health Nursing | 11 | 0.01 |
| Certification - Correctional Nursing (CCRN)** | - | - |
| Other certification, not listed | 4,436 | 4.8 |
| *Totals may exceed 100% due to multiple responses; calculated as % of respondents. | ||
| **Missing observations due to a technical problem. |
| LPN Top Medical Certifications | Total | Percent |
|---|---|---|
| Total LPN | 8,683 | 100 |
| Not certified | 6,255 | 72.0 |
| IV Certification | 1,272 | 14.7 |
| Geriatrics/Gerontology | 460 | 5.3 |
| Wound Care Certification | 266 | 3.1 |
| Emergency Medicine | 218 | 2.5 |
| Mental Health Nursing | 136 | 1.6 |
| Certified Hospice and Palliative Licensed Nurse | 66 | 0.8 |
| Certified Hemodialysis Nurse | 24 | 0.3 |
| Cardiac-Vascular Nursing | 20 | 0.2 |
| Other | 587 | 6.8 |
| *Totals may exceed 100% due to multiple responses; calculated as % of respondents. |
The charts summarizes the primary work settings of RN and LPN survey respondents. Primary work refers to the setting in which a nurse works the most hours, regardless of whether the work is paid or voluntary. Among RNs, the majority were employed in hospitals (52.3%), followed by ambulatory care (21.1%) and extended care (7.0%). In contrast, LPNs primarily worked in extended care (39.3%), followed by ambulatory care (27.5%), and hospitals (9.3%). Regarding job roles, most RNs identified as staff nurses (62.2%), followed by Advanced Practice Nurses (9.3%), nurse managers (7.2%), and case managers (6.0%).
The charts below presents information on telehealth and remote work at respondents primary place of employment. Among RNs, 35.6% never provided services by telephone, 27.5% spent less than 25% of their time on the phone, 8.4% spent 26-50%, 8.2% spent 51-75%, and 20.3% spent 76- 100%. Among LPNs, 33.8% never used the phone, 19.9% spent less than 25% of their time on the phone, 9.7% spent 26-50%, 10.7% spent 51-75%, and 26.0% spent more than 75% of their time providing services via telephone. The most frequently used remote communication method for both RNs and LPNs was the telephone (49.2% and 46.8%, respectively), followed by electronic messaging (21.5% and 24.6%), and email (16.2% and 17.7%).
Income
The charts below provides information on annual pre-tax earnings at primary workplaces in Wisconsin. Considering compensation in the primary position, 26.3% of RNs were full-time salaried and 48.6% were full-time hourly. For LPNs, the majority were full-time hourly (61.8%), while 10.8% were full-time salaried. Considering only full-time positions, 17.0% of RNs had annual pre-tax earnings in the range of $75,001 to $85,000, followed by $65,001 to $75,000 (15.7%), and $85,001 to $95,000 (13.6%). Notably, 35.0% of RNs earned more than $95,000, while 18.8% earned less than $65,000 per year. For LPNs, 43.2% earned less than $55,000 per year in their primary job, followed by $55,001 to $65,000 (21.3%) and $65,001 to $75,000 (14.6%). Only 20.9% of the LPNs earned $75,000 or more.
| Income Principal Place of Work | RN | RN % | LPN | LPN % |
|---|---|---|---|---|
| Compensation in Primary position | 81,098 | 100 | 7,625 | 100 |
| Full time, salaried | 21,289 | 26.3 | 825 | 10.8 |
| Full time, hourly wage | 39,449 | 48.6 | 4,713 | 61.8 |
| Part time, salaried | 1,948 | 2.4 | 57 | 0.8 |
| Part time, hourly wage | 14,794 | 18.2 | 1,513 | 19.9 |
| Per diem | 3,446 | 4.3 | 500 | 6.6 |
| Volunteer | 171 | 0.2 | 16 | 0.2 |
| Annual Pre-tax Earnings* | 60,738 | 100 | 5,538 | 100 |
| < $25,000 | 805 | 1.3 | 154 | 2.8 |
| $25,001 - $35,000 | 679 | 1.1 | 297 | 5.4 |
| $35,001 - $45,000 | 1,053 | 1.7 | 735 | 13.3 |
| $45,001 - $55,000 | 2,548 | 4.2 | 1,203 | 21.7 |
| $55,001 - $65,000 | 6,390 | 10.5 | 1,178 | 21.3 |
| $65,001 - $75,000 | 9,514 | 15.7 | 808 | 14.6 |
| $75,001 - $85,000 | 10,322 | 17 | 556 | 1 |
| $85,001 - $95,000 | 8,259 | 13.6 | 281 | 5.1 |
| $95,001 - $105,000 | 6,844 | 11.3 | 155 | 2.8 |
| $105,001 - $115,000 | 4,677 | 7.7 | 63 | 1.1 |
| $115,001 - $125,000 | 3,021 | 5 | 47 | 0.9 |
| $125,001 - $135,000 | 2,010 | 3.3 | 24 | 0.4 |
| $135,001 - $145,000 | 1,245 | 2.1 | 7 | 0.1 |
| $145,001 - $155,000 | 826 | 1.4 | 6 | 0.1 |
| > $155,000 | 2,545 | 4.2 | 24 | 0.4 |
| *Includes overtime and bonuses, but excludes sign-on bonuses. Only full-time positions are included. |
The charts illustrate full-time annual pre-tax earnings at primary workplaces by education level for RNs and LPNs, respectively.
As expected for RNs, lower educational attainment was associated with a higher proportion of RNs in the lower income brackets, and a smaller presence in the higher income brackets. Conversely, for higher levels of income, a greater proportion of RNs tended to hold a bachelors, masters, or doctoral degree. Specifically, nearly 83% of RNs earning more than $95,000 annually had at least a bachelor degree. A similar pattern is observed for LPNs: those with lower educational attainment were more likely to fall within the lower income brackets, while those in higher income brackets were more likely to hold an associate, bachelors, masters, or doctoral degree.
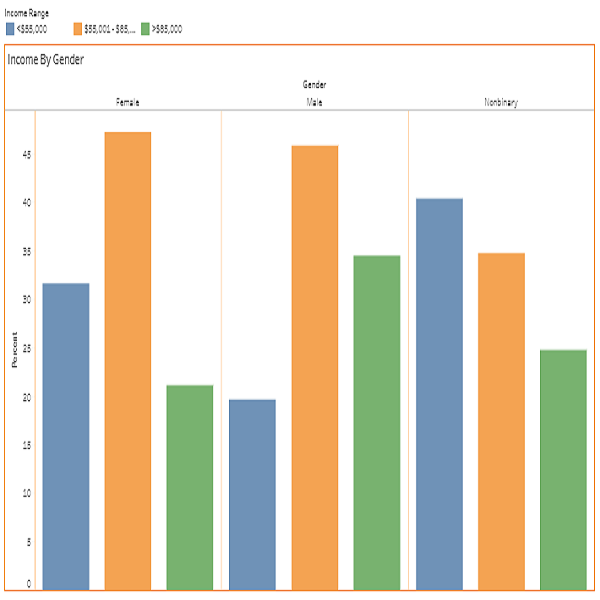
The following figures show annual pre-tax earnings at their primary workplace by gender identity for RN and LPN.
The first chart presents full-time annual pre-tax earnings at primary workplaces by gender identity for RNs. Among women, 57.8% fell within the middle earning range of $55,000 to $95,000, 8.6% earned less than $55,000, and 33.6% earned more than $95,000. For men, 47.3% were in the middle range, 46.4% earned more than $95,000, and 6.3% earned less than $55,000. Among those identifying as nonbinary, 63.0% were in the middle range, 24.3% earned more than $95,000, and 12.7% earned less than $55,000. Overall, the data revealed a gender-based gap in earnings above $95,000, with men more likely than women and nonbinary RNs to be in the highest income category.
The second chart shows full-time annual pre-tax earnings at primary workplaces by gender identity for LPNs. Among women, 44.1% earned less than $55,000, 50.3% earned between $55,000 and $95,000, and only 5.5% earned more than $95,000. Among men, most earned between $55,000 and $95,000 (58.7%), followed by 30.1% who earned less than $55,000 and 11.3% who earned more than $95,000. For respondents identifying as nonbinary, 50.0% earned less than $55,000, 25.0% earned between $55,000 and $95,000, and 25.0% earned more than $95,000.
Artificial Intelligence
Artificial Intelligence (AI) This new section of the report focuses on Artificial Intelligence (AI) and employment. Research suggests that AI can support nurses by reducing administrative tasks, aiding clinical decision-making, and improving work-life balance without replacing their critical role in patient care. The most recent surveys incorporated questions about the use of AI in the primary workplace. Among respondents, 3,736 RNs (4.6%) and 174 LPNs (2.3%) reported using AI in their primary positions. It is important to note that the WRNS 2024 survey was conducted between January and February 2024, while the LPN survey took place between March and April 2025. This timing difference may help explain the relatively low proportion of nurses using AI.
| Effect of Artificial Intelligence (AI) on the Workplace | RN | RN % | LPN | LPN % |
|---|---|---|---|---|
| Using AI at Primary Place of Work | 81,098 | 100 | 7,631 | 100 |
| Yes | 3,736 | 4.6 | 174 | 2.3 |
| No | 77,362 | 95.4 | 7,457 | 97.7 |
| Areas of Work that use AI | 3,736 | 100 | 174 | 100 |
| Assessment | 2,366 | 63.3 | 67 | 38.5 |
| Diagnosis | 1,643 | 44.0 | 33 | 19.0 |
| Implementation | 1,630 | 43.6 | 57 | 32.8 |
| Planning | 1,339 | 35.8 | 109 | 62.6 |
| Evaluation | 1,222 | 32.7 | 47 | 27.0 |
| Impact of AI on Employee Productivity | 3,736 | 100 | 174 | 100 |
| Much better than before AI was implemented | 422 | 11.3 | 26 | 14.9 |
| Better than before AI was implemented | 1,212 | 32.4 | 40 | 23.0 |
| About the same as before AI was implemented | 1,907 | 51.0 | 96 | 55.2 |
| Worse than before AI was implemented | 166 | 4.4 | 10 | 5.8 |
| Much worse than before AI was implemented | 29 | 0.8 | 2 | 1.2 |
| AI Within Primary Place of Employment | 3,736 | 100 | 174 | 100 |
| Hospital (Medical / Surgical, AODA/Psychiatric, Long-Term Acute Care) | 2,130 | 57.0 | 21 | 12.1 |
| Ambulatory Care (Employee Health, Outpatient Care, Clinics, Surgery Center) | 731 | 19.6 | 75 | 43.1 |
| Home Health (Private Home) | 184 | 4.9 | 8 | 4.6 |
| Extended Care (Nursing, Hospice, CBRF, RCAC, AFH Facilities) | 150 | 4.0 | 40 | 23.0 |
| Educational Institutions | 150 | 4.0 | N/A | N/A |
| Community/Public Health | 41 | 1.1 | 5 | 2.9 |
| Correctional Care | * | * | * | * |
| Tribal Health | * | * | * | * |
| Other (Insurance, call center etc.) | 343 | 9.2 | 20 | 11.5 |
| *Estimate not shown because of small sample size | ||||
| N/A = Data not collected for this category |
Of those RNs using AI, 63.3% used it for assessment (for example, identifying patient risk for adverse events), 44.0% for diagnosis (for example, querying databases such as UpToDate), 43.6% for implementation (for example, auto documentation of care provided), 35.8% for planning (for example, nurse assignments or patient placement), and 32.7% for evaluation (for example, comparing outcomes for patients with a specific condition receiving treatment plan A versus B). Among LPNs using AI, 62.6% used it for planning, 38.5% for assessment, 32.8% for implementation, 27% for evaluation, and 19.0% for diagnosis.
The survey also asked about the impact of AI on nurses productivity. Many technology companies are increasingly developing AI tools for healthcare aimed at improving clinical decision-making and patient engagement, reflecting a broader trend of integrating generative AI into care delivery. However, as with other AI applications, its growing use in healthcare raises concerns about safety, ethics, and the potential risks of over-reliance on technology.13 Among respondents who were using AI, 51.0% of RNs and 55.2% of LPNs reported that their productivity was about the same as before AI was implemented. Another 43.7% of RNs and 37.9% of LPNs said their productivity was better or much better, while only 5.2% of RNs and 7.0% of LPNs reported their productivity was worse or much worse than before AI was integrated into their work routines.
When considering AI use in the workplace, most RNs worked in hospitals (57.0%), followed by ambulatory care (19.6%), home health (4.9%), extended care (4.0%), educational institutions (4.0%), and community/public health (1.1%). Among LPNs, the largest proportion worked in ambulatory care (43.1%), followed by extended care (23.0%), hospitals (12.1%), home health (4.6%), and community/public health (2.9%).
Advanced Practice Registered Nurses
The WRNS also provides data on Advanced Practice Registered Nurses (APRNs). Chapter N 8 of the Wisconsin Board of Nursing defines APRNs and outlines the certification requirements for a specific subset of advanced practice nurses known as Advanced Practice Nurse Prescribers (APNPs).
According to Chapter N 8,15 an Advanced Practice Nurse must: 1. Hold a current license to practice in Wisconsin or in another state that is part of a licensure compact; 2. Be certified as a nurse-midwife, certified registered nurse anesthetist (CRNA), or clinical nurse specialist (CNS); 3. Hold a masters degree in nursing or a related health field. Advanced Practice Nurses who were certified in any of these fields prior to July 1, 1998, are not required to hold a masters degree. To be certified as an APNP, a nurse must meet all APRN criteria and, in addition: Complete at least 45 contact hours in clinical pharmacology or therapeutics, and pass a jurisprudence examination specific to APNPs.
There were 7,576 nurses (8.2%) working as APRNs in 2024. Among them, 6,885 (90.9%) provided DPC and worked in Wisconsin, while 691 (9.1%) worked outside the state. To be recognized as an APRN in Wisconsin, in addition to holding an RN license and a graduate degree in an advanced nursing role, nurses must also obtain a national board certification in one of the four APRN roles: Nurse Practitioner (NP), Certified Nurse Midwife (CNM), Certified Registered Nurse Anesthetist (CRNA), or Clinical Nurse Specialist (CNS). The most common national certification was NP (82.6%), followed by CRNA (11.0%), CNS (4.1%), and CNM (3.1%). Additionally, 8,562 nurses were APNPs, and 7,466 (87.2%) of them worked in Wisconsin.
The table lists NP and CNS specialties. The nurses surveyed could choose more than one response. In the case of NPs, the top specialty was Family (55.0%), followed by Adult Health (16.4%), Acute Care (8.6%), Gerontological (8.2%), and Pediatric (6.0%). Certification and Specialization of APRNs were Adult Health (40.5%), Gerontological (23.3%), Acute and Critical Care-Adult (18.0%), and Adult Psychiatric and Mental Health (16.7%).
| Certification and Specialization of Advanced Practice Nurses (APRN) | Total | Percent |
|---|---|---|
| Working as an APRN | 93,008 | 100 |
| Yes | 7,576 | 8.2 |
| No | 85,429 | 91.9 |
| Working as an APRN and Provides Direct Patient Care in WI | 7,576 | 100 |
| Yes | 6,885 | 90.9 |
| No | 691 | 9.1 |
| National Board Certification as APRN (Check all that apply)* | 9130 | 100 |
| Nurse Practitioner (NP) | 7,545 | 82.6 |
| Certified Nurse Midwife (CNM) | 285 | 3.1 |
| Certified Registered Nurse Anesthetist (CRNA) | 1,007 | 11 |
| Clinical Nurse Specialist (CNS) | 378 | 4.1 |
| Credentialed as an Advanced Practice Nurse Prescriber (APNP) | 8,562 | 100 |
| Works in Wisconsin as APNP | 7,466 | 87.2 |
| Works outside of Wisconsin as APNP | 1,096 | 12.8 |
| Nurse Practitioner Specialty (Check all that apply)* | 7545 | 100 |
| Family | 4,148 | 55 |
| Adult Health | 1,237 | 16.4 |
| Acute Care | 650 | 8.6 |
| Gerontological | 619 | 8.2 |
| Pediatric | 455 | 6 |
| Family Psych & Mental | 364 | 4.8 |
| Adult Psychiatric & Mental Health | 297 | 3.9 |
| OB-Gyn / Women's Health Care | 287 | 3.8 |
| No specialty designation | 180 | 2.4 |
| Neonatal | 158 | 2.1 |
| Not currently certified | 66 | 0.9 |
| Emergency Nursing | 65 | 0.9 |
| Diabetes Management | 33 | 0.4 |
| Family Planning | 17 | 0.2 |
| Clinical Nurse Leader | 16 | 0.2 |
| School | 9 | 0.1 |
| College Health | 5 | 0.1 |
| Other Specialty | 525 | 7 |
| Clinical Nurse Specialty (Check all that apply)* | 378 | 100 |
| Adult Health | 153 | 40.5 |
| Gerontological | 88 | 23.3 |
| Acute and Critical Adult | 68 | 18 |
| Adult Psychiatric & Mental Health | 63 | 16.7 |
| OB-Gyn / Women's Health Care | 35 | 9.3 |
| Pediatric | 35 | 9.3 |
| Medical-Surgical | 26 | 6.9 |
| Child & Adolescent | 17 | 4.5 |
| Diabetes Management | 14 | 3.7 |
| Acute and Critical Pediatric | 12 | 3.2 |
| Home Health | 11 | 2.9 |
| Community/Public | 10 | 2.6 |
| Palliative Care | 7 | 1.9 |
| Acute and Critical Neonatal | 3 | 0.8 |
| Other Specialty | 136 | 36 |
| No specialty designation | 234 | 61.9 |
| Outpatient Primary Care or Mental Health Services* | 3194 | 100 |
| Family | 1,478 | 46.3 |
| Women's Health | 888 | 27.8 |
| Perinatal or reproductive health | 267 | 8.4 |
| Pediatric | 744 | 23.3 |
| Adult | 1,448 | 45.3 |
| Geriatric | 1,025 | 32.1 |
| Mental health services | 1,003 | 31.4 |
| Other | 232 | 7.3 |
| *Totals may exceed 100% due to multiple responses; calculated as % of respondents. |
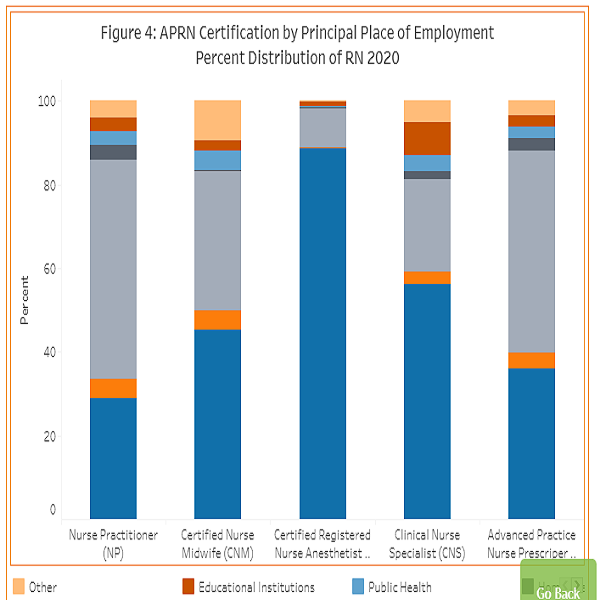
APRN certification by principal place of employment. A combined 84.70% of all APNPs are working in either Ambulatory Care (48.03%) or in Hospitals (36.67%). The remainder are in Extended Care (4.26%), Public Health (2.75%), Education Institutions (2.52%), and Home Health (2.37%). More than 50% of NPs and almost 50% of CNMs are working in Ambulatory Care, followed by Hospitals. CRNAs and CNSs are largely in Hospitals 88.79% and 52.91% respectively, followed by Ambulatory Care.
| APRN Certification by Principal Place of Employment | NP | %NP | CNM | %CNM | CRNA | %CRNA | CNS | %CNS | APNP | %APNP |
|---|---|---|---|---|---|---|---|---|---|---|
| Hospital | 2,239 | 31.3 | 111 | 42.4 | 853 | 87.4 | 197 | 60.4 | 3,118 | 38.1 |
| Extended Care | 344 | 4.8 | 2 | 0.8 | 2 | 0.2 | 8 | 2.5 | 343 | 4.2 |
| Ambulatory Care | 3,530 | 49.3 | 109 | 41.6 | 107 | 11.0 | 56 | 17.2 | 3,690 | 45.0 |
| Home Health | 221 | 3.1 | 4 | 1.5 | 1 | 0.1 | 8 | 2.5 | 220 | 2.7 |
| Community/Public Health | 230 | 3.2 | 11 | 4.2 | N/A | 0.0 | 8 | 2.5 | 231 | 2.8 |
| Educational Institutions | 200 | 2.8 | 9 | 3.4 | 9 | 0.9 | 26 | 8.0 | 197 | 2.4 |
| Correctional Care | 53 | 0.7 | N/A | 0.0 | N/A | 0.0 | 2 | 0.6 | 53 | 0.7 |
| Tribal Health | 41 | 0.6 | 1 | 0.4 | N/A | 0.0 | N/A | 0.0 | 42 | 0.5 |
| Other (Insurance, call center etc.) | 303 | 4.2 | 15 | 5.7 | 4 | 0.4 | 21 | 6.4 | 298 | 3.6 |
| Total | 7,161 | 100 | 262 | 100 | 976 | 100 | 326 | 100 | 8,192 | 100 |
Reports
Registered Nurses and Licensed Practical Nurses complete a survey at each biennial license renewal. The results from these surveys are used to provide extensive reports to the state legislature and to periodically produce long-term supply and demand forecasts.